Algebra 1. 3
Course Description
In the last section, you learned about ‘equations’. What if the two sides of the equations are not equal but one is more than the other? Are there statements in the form of equations that are true for any values of the variables?
This section deals with algebraic identities and inequalities.
Prior knowledge required:
-
- Knowledge of solving linear equations
- Graphing linear equations
- Knowledge of quadratic equations and their graphs (for unit IV only).
_________________________________________________________________________________
Algebra 1.3 – Units & Links
- Unit I: Algebraic Identities
- Unit II: Linear Inequalities in one variable
- Unit III: Linear Inequalities in two variables
- Unit IV: Quadratic inequalities
- Unit V: Inequalities between two functions
Unit I: Algebraic Identities
There are three important identities in algebra:
The video below explains the proof of the above identities:
Now try to find the identities for the following:
=
=
=
=
Discuss:
What is the difference between an equation and an identity?
Discuss your views in this blog.
***
Unit II:Linear Inequalities in one variable
Below is something you have seen in your earlier years. This is called a number line. It has all the real numbers that you know so far.
This number line is going to help us solve linear inequalities. What is linear inequality?
Look at this statement:
List all the numbers that are less than 4
What would be your answer?
Will it be {… -3, -2, -1, 0, 1, 2, 3}?
Yes. This looks great. But isn’t 3.5 less than 4? What about -3.5? Are they in the list given above?
NO. Because, the list of numbers in the set are only Integers. The decimals in between these Integers are not used. Hence this set of numbers do not give all the required numbers.
So how will we give the answer?
Maybe {...-2.5, -2, -1.5, -1, -0.5, 0, 0.5, 1, 1.5, 2, 2.5, 3, 3.5 } ?
Looks better!
But, what about 3.8? Isn’t that also less than 4? or say, 3.9999999?
Hmm..! So, we have got lots of numbers such as -1.34566544, 1.3333333, 3.123456…, etc. that are not included in the set above.
And…
\sqrt{3} = 1.732.... \sqrt{2} = 1.414... \sqrt{5} = 2.236...are also numbers that are less than 4.
All these numbers can be seen on a number line as shown here:

There are still more numbers that are not shown in the above number line. How to show ‘all’ the numbers that are less than 4?
In other words, how to represent ‘all‘ real numbers that satisfy the inequality x less than 4 (x < 4)?
This is where the number line comes handy. Look at the figure shown below. There is an arrow starting from 4 and going towards the negative side of the number line. What does this arrow represent?

The red arrow in the above figure shows all the real numbers that are less than 4. You should have noticed the red circle on top of the number 4. This red circle means that 4 is not included in the answer, simply because we wanted numbers less than 4 and not equal to 4. The open circle means that all numbers except 4 but anything just before 4 is included in the set. This includes even 3.99999999…….The notations that are used for different inequalities are given below:
< : Strictly less than (not including the number on the right)
≤: Less than or equal to (includes the number on the right)
>: Strictly greater than (not including the number on the right)
≥: Greater than or equal to (includes the number on the right)
Let us see how to represent the ‘solution set‘ for the following inequalities:
a. x > -1
This has the inequality > , ‘strictly greater than‘, which means -1 is NOT included but anything just greater than -1 is included. For example, -1.000000000001 is included, hence we put an ‘open circle‘ on top of -1 as shown below:

b. x≤ 2.5

Notice the red circle here. The inequality is asking for numbers that are less than and equal to 2.5. Hence the number 2.5 is included in the answer. In such cases, we fill the circle that represent the number. This is usually called a closed circle or shaded circle.
c. x ≥ 1.3

In this example, the numbers are greater than or equal to 1.3. So the x will take all numbers that are to the right of 1.3 including 1.3
In the two examples (b) & (c), above in which the numbers on the right side of the inequalities were decimals, you should have noticed that no other decimals were shown on the number line except the required one (2.5 & 1.3). It is not required to write all other numbers but just be careful to denote that in an appropriate position. For example, let 1.3 be marked closer to 1 than to 2.
Now try to draw a number line for each of the following inequalities:
a. x > 2
b. x ≤ -4
c. x ≥ 2.3
d. x < -1.25
e. x ≤ \sqrt{3}
Now, what if you had an algebraic expression in x on the left side of the inequality?
For example, 2x + 1 < 6.
In such cases, treat the inequality as a linear equation and make x the subject.
A similar set of steps as solving a linear equation is performed as shown below:
2x + 1 < 6Subtract 1 on both sides and simplify:
2x + 1 - 1 < 6 - 1
2x < 5Divide both sides by 2
\dfrac{2x}{2}<\dfrac{5}{2} \Rightarrow x<\dfrac{5}{2}
This is the solution for the given inequality. Representing it on the number line as shown below:

Before we proceed to the next example, let us make note of the following property of inequality:
We know that 2 < 3.
If we multiply by -1 on both sides, we get -2 on the left and – 3 on the right. Comparing these two numbers, we will get
-2 > -3
Notice how the inequality changes its direction here.
Check with one more inequality, say 10 < 20.
Multiplying by a negative number, say -2, on both sides we get, -20 > -10
What if the original inequality was both negative or of opposite signs?
Check by considering -2 > -5 and -3 < 7.
Multiply (or divide) both sides by -1 ( or any negative number) and see what happens to the inequality!
Did the direction change?
So the property is:
When an inequality is multiplied (or divided) by a negative number on both the sides, the direction of the inequality reverses.
Let us consider an example:
3 - 2x > 7
The first step would be to eliminate 3 on the left side.
That is to subtract 3 on both sides.
3 - 2x - 3 > 7 - 3
Divide by -2 on both sides.
\dfrac{-2x}{-2}{\color{red}{<}}\dfrac{4}{-2}Notice the change in the direction of the inequality while dividing by -2.
The final answer will be x < -2 and this can be shown on a number line which is left to the reader.
More complex form of expressions can be present on both the sides of the inequality as seen in linear equations. In such cases as well, the process is similar to solving linear equations. If you haven’t learned how to solve simple linear equations check on this link solving equations before proceeding further.
Example:
Open the parentheses on both sides:
2x - 6 + 7 ≤ 3 - 5x - 5
Simplify on both sides:
2x +1 ≤ - 5x - 2
Collect the x terms to the left and the constants to the right:
Add 5x to both sides to eliminate the -5x on the right.
2x + 1 +5x ≤ -5x - 2 + 5x1 + 7x ≤ -2
Subtract 1 on both sides:
1 +7x - 1 ≤ -2 -17x ≤ -3
Divide by 7 on both sides:
\dfrac{7x}{7}\leq\dfrac{-3}{7}x\leq\dfrac{-3}{7}
And this can be easily represented on a number line.
Check your understanding:
Solve the following inequalities:
- 2x - 4 < 3
- 3 - 8x > 2
- -2 - 9x ≤ 5
- 2x - 1 ≥ 3 - x
- 3(x - 2) < 2x + 1
- \dfrac{x+1}{3}\leq 5x - 4
Unit III: Linear Inequalities in two variables
An equation in two variables would look like : y = ax + b
Hence an inequality in two variables would look like: y ≤ ax + b or y ≥ ax + b, where x and y are the variables and a and b are any real numbers.
Let’s consider an example y ≥ 3x - 1 :
The inequality y ≥ 3x - 1 holds true,
for x = 2 and any y ≥ 5;
Or
for x = - 1 and any y ≥ - 4 and so on. We get many y-values for each x-value that we choose.
So, we can say that, for instance, (2, 6) is one of the many points that satisfy the inequality. In fact, there are infinite number of solutions for such inequalities.
In order to understand how to solve inequalities with two variables, click on the following activity worksheet. You can proceed further only after completing this activity.
Activity : Two variable inequality
Click the link below to watch a video for the solutions of the above activity:
https://www.youtube.com/watch?v=6kJOCmiV8L4&feature=youtu.be
From the above activity, you would have realized that the solutions for a two – variable linear inequality can only be represented on a graph as shaded area. When trying to find the solution set for an inequality, pick any coordinate and check if it satisfies the inequality or not. If it does, shade the region where the point lies and if not, shade the opposite side of the line.
For example, for finding the shaded area of y≤ 2x + 1, a random point, say, (1, 2) satisfies the inequality. Hence shade the side of the line y = 2x +1, that contains the point (1, 2).
You can use (0,0) as a default point for all inequalities except those of the type, y ≤ mx or y ≥ mx. Why?
Before proceeding to the next section, let us learn what it means by y > 3x-1 when y = 0 or y = 1.
Clearly, when a value for y is fixed, the inequality becomes one-variable inequality, i.e., only x will be present in the inequality.
When y = 0, it becomes, 0 > 3x - 1 or when y = 1, it becomes, 1 > 3x - 1. These can also be written as:
3x - 1 < 0and
3x - 1 < 1The above two inequalities can be easily solved and the solutions can be represented on a number line (refer previous section).
x < 1/3x < 2/3
Can this be applied on a two dimensional coordinate plane?
Yes! Though the solutions do not represent an area on the coordinate plane, the values are a set of real numbers and can be represented on the x – axis.
Look at the following graphs. Both the graphs have the line y = 3x -1 as the reference line. y = 0 is the x-axis and y = 1 is a line parallel to the x-axis. All we are looking at is the part of the line y = 3x - 1 that is below these two horizontal lines (the blue dotted parts) and the corresponding x values ( the green arrows on the x-axis). 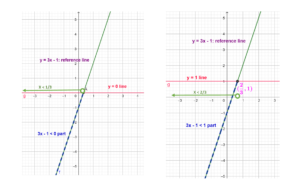
Notice that the green arrows represent the solutions x < 1/3 and x < 2/3 on the number line. And this part of the x– axis has x values that give the blue dotted parts of the line, which is the inequality we are looking for.
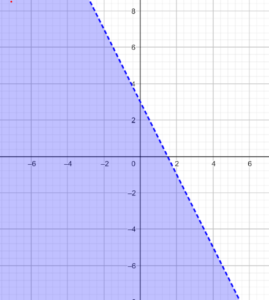
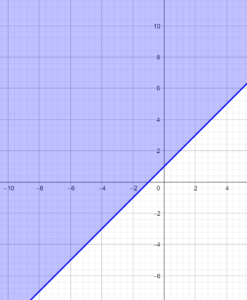
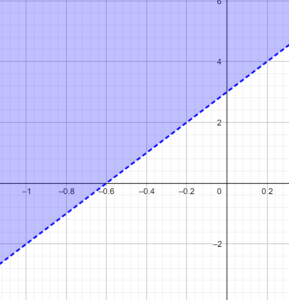
Now try to identify the inequalities represented by the dotted blue line on each of the following figures and find their solutions on the x-axis:
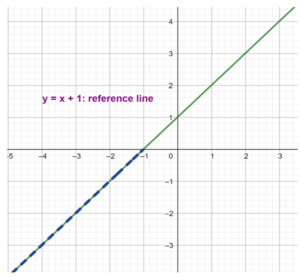
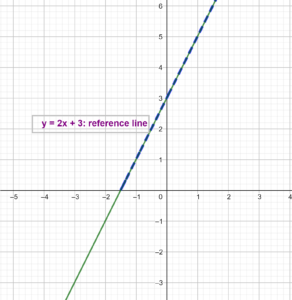
From the above examples, we can easily understand the difference in the solution set for a two- variable inequality and a one-variable inequality. Summarize them in your notebook before proceeding further.
Identify the solution sets for the following. Which of them would be a set of real numbers on a number line and which would be a set of ordered pairs on a coordinate plane? Represent them on appropriate diagrams.
- 2x - 3 ≤ 5
- 3 - 2x > y
- -1 ≥ x - y
- y > 5x+ 3
- 3 ≤ 5 - x
- 3y - 2 < x
Unit IV: Quadratic inequalities
In the graph below, the x values for the part of the curve in blue dotted lines are in the interval (-3, 1). The blue dotted part of the curve is below the x-axis and hence the values of y is negative, which gives the inequality, x^2+2x-3<0
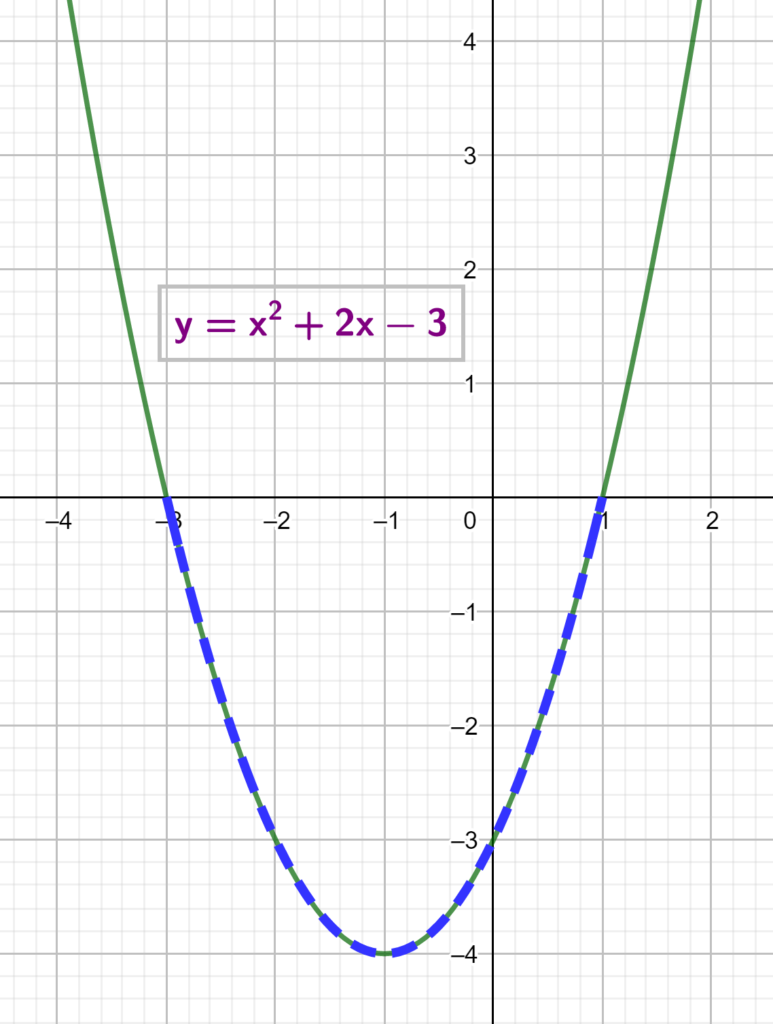
Note: Since the extremes of the x values viz. -3 and 1 are not included, the x values are in the open interval (-3,1). If the extreme values were included then the inequality would be x^2+2x-3\leq 0 and the interval would be [-3,1]
Find the x values corresponding to the blue dotted lines in the graphs shown below. Also write down the inequalities represented by the dotted lines.
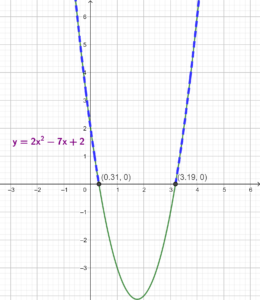
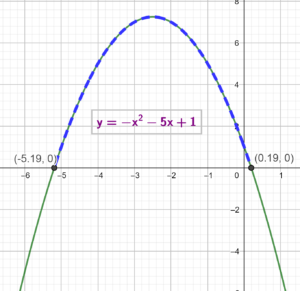
The above examples represent quadratic inequalities. You would have noticed the important role played by the x-intercepts here too. Hence, in order to solve a quadratic inequality, it is necessary to find the x-intercepts (otherwise called as roots or zeros) of the given quadratic equation.
The video given below briefs the different aspects of quadratic inequality
Check your understanding:
Solve the following inequalities:
Inequalities using higher degree polynomials:
In the same way as solving quadratic inequality, we can solve any inequalities with higher degree polynomials such as cubic, quartic etc. In fact, we can solve inequalities involving any function (Refer to the topic ‘function’ if you have not learnt it so far)
Any graph will have part of it either above or below the x-axis, which means there are certain x values for which y is positive or negative. For example, the graph of the cubic equation y = 3x^3+6x^2-3x-6 given below leads to various cubic inequalities:
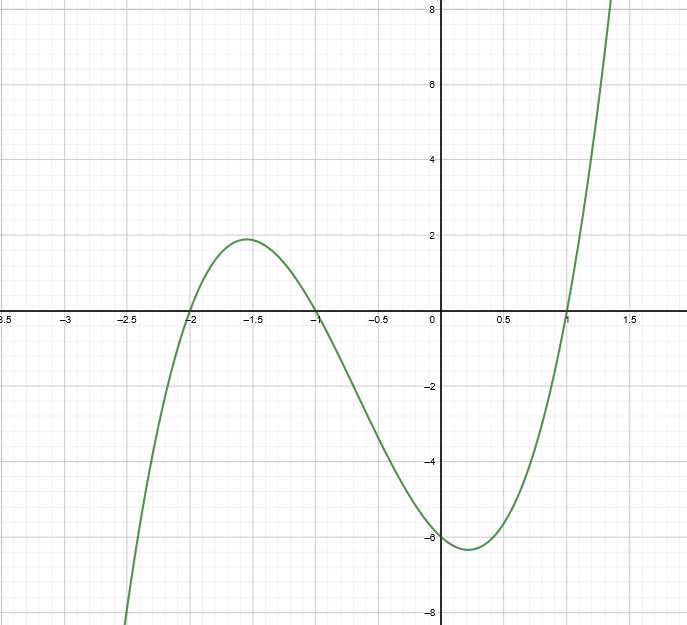
The roots are -1, -2 and 1.
Hence the solution of 3x^3+6x^2-3x-6\leq 0 would be (-\infty, -2]\cup[-1, 1]
and the solution of 3x^3+6x^2-3x-6\geq 0 would be[ -2, -1]\cup[1, \infty]
Unit V: Inequalities between two functions
This unit should be done after learning ‘functions’ (functions topic coming soon)
In the above sections we solved linear inequalities and quadratic inequalities where in each case the right hand side had 0 or any other number. What if there were functions on both the sides of the inequalities? You have already seen such a situation in question 5 under ‘check your understanding’ part in the previous section.
This can be solved either by rearranging all the terms to one side as shown below (which is what you would have done in the previous section):
x(1+x)-1\leq0Making this into a quadratic inequality,
x^2 +x-1\leq 0which can be easily solved as quadratic inequality.
In the above example, you were able to simplify the functions on both the sides of the inequality into a simple quadratic inequality. This might not be possible always.
Look at this example:
e^{x+1}\leq x^2-2x+1There is no way that you can simplify this into a single function on one side. So, it is only possible to solve this type of functions using technology. Watch the video below to know how to solve such inequalities using graphing software such as Geogebra.
(Video explaining how to solve inequalities with functions on both sides)


 3.
3.  4.
4.  5.
5. 
